Written after the final whistle. Spain are world champions — which is where this story ends up. It starts somewhere more embarrassing.
Key takeaways
- I finished 7th of my whole company in a global World Cup 2026 prediction game at 75% accuracy — the highest near the top of the table — without properly watching a single match.
- The engine is a Dixon-Coles Poisson model from 1997, not machine learning — chosen for interpretability on ~1,600 matches of data.
- The edge came from two things: picking scorelines that maximise expected points, and calibrating to 41 bookmakers.
- The honesty: every pick was frozen before kickoff, and the "star-player quality" feature was measured, found harmful, and deleted.
Let me get the embarrassing part out of the way: I finished 7th in my company's global World Cup prediction game — with 75% accuracy, the highest of anyone near the top of the table — and I did not properly watch a single match.
It's not for lack of love. I'm a Premier League person, an Arsenal fan in Singapore, which means my football education happened on Saturday nights at 10:30pm — a civilised hour. This World Cup was in the Americas, so every kickoff landed between 1am and 5am Singapore time. There's devotion, and then there's a 3am group-stage match on a work night. I know my limits.
But my company's prediction game is global — colleagues in India, Israel, Spain, all posting picks — and I wasn't going to sit it out just because I'd be unconscious during the actual football. So I did the only reasonable thing for someone who works with data: I built something to watch the tournament for me.
Six weeks later it was a full website — score predictions, player ratings, a tournament simulator — that retrained itself twice a day while I slept. This is the story of what I built, how it actually works, and, more usefully, everything I got wrong along the way. Because I built this to learn, and the learning was mostly in the mistakes.

The one idea that does most of the work
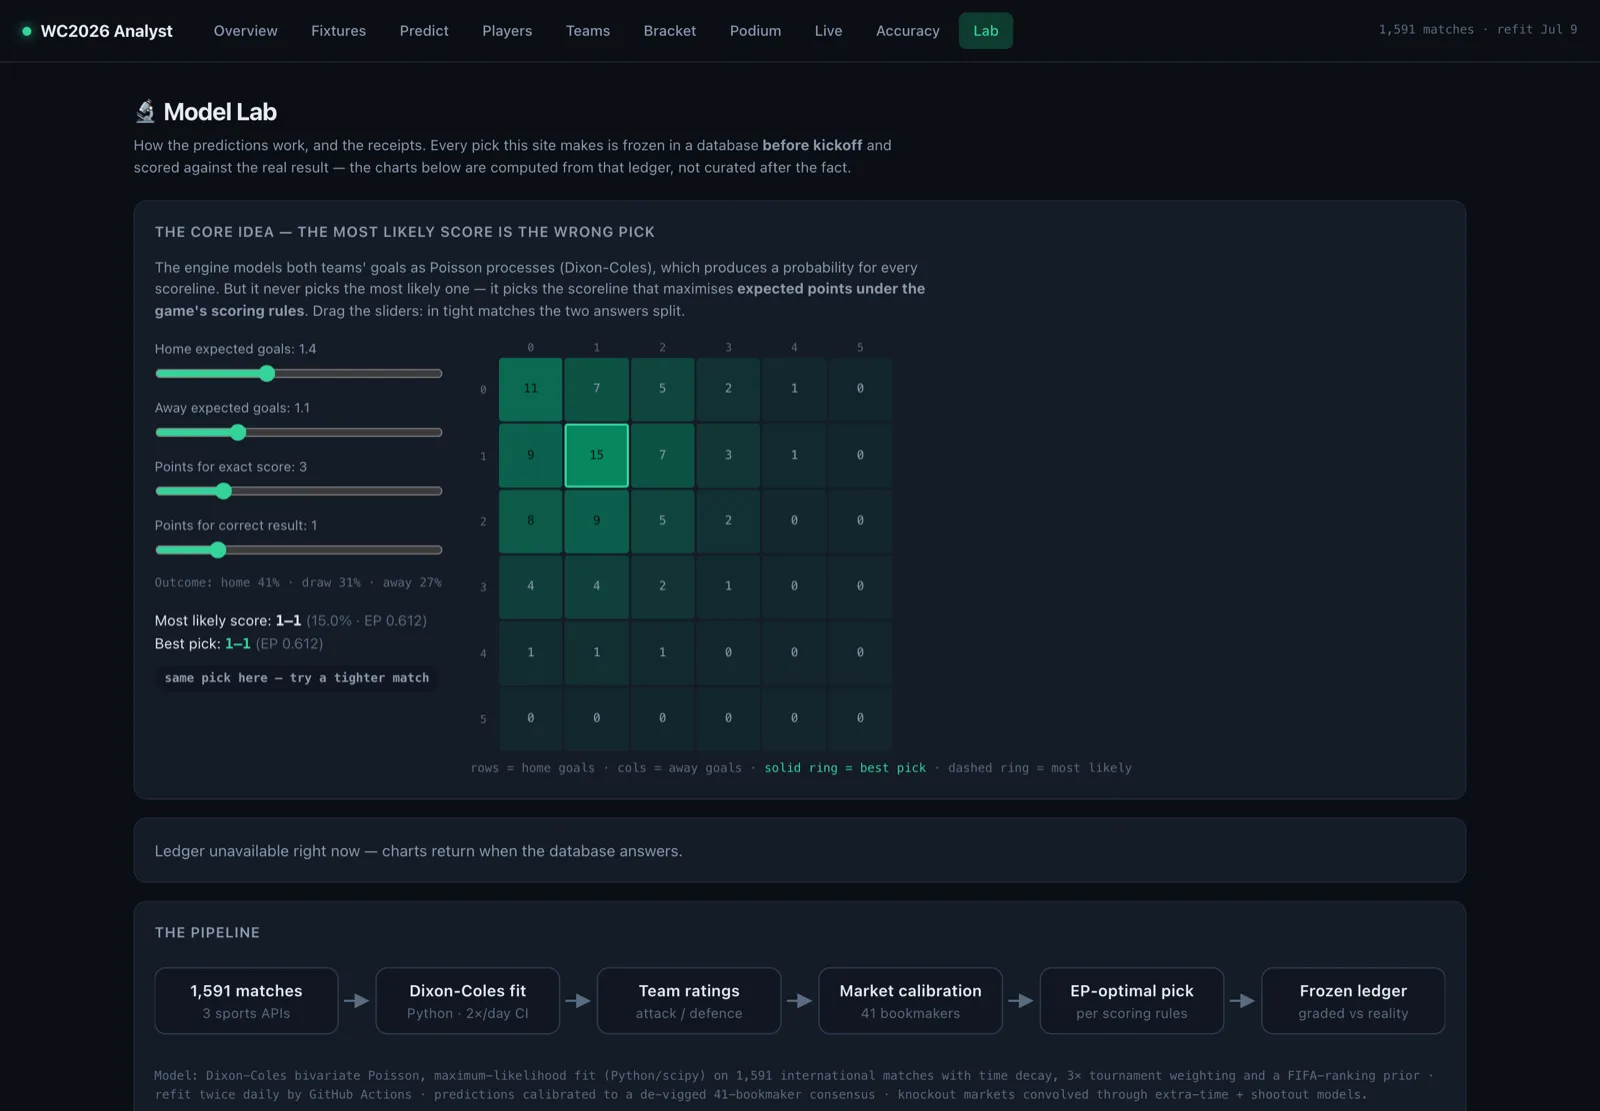
My game gives 3 points for an exact score, 1 for the right result. Everyone I know picks the score they think is most likely. That turns out to be subtly wrong, and realising why was the moment this project got interesting.
Real example: the model rated 1–1 the single most likely score in one match, at 15%. But if you compute the expected points of every possible pick — summing what each would earn across all the ways the match could end — picking 1–0 was worth 0.713 points on average, versus 0.642 for the 1–1. The 1–0 is wrong more often, and still worth more, because of how the partial credit stacks up.
The site never asks "what's the likeliest score?" It asks "which pick maximises expected points under the rules?" Different question, better answer, and honestly a transferable life lesson: optimise what you're actually scored on.
(Arsenal optimising for beautiful November football instead of May trophies is left as an exercise for the reader.)
What I actually built
- Score predictions for every fixture — a probability for every possible scoreline, blended with bookmaker odds, and the expected-points-optimal pick.
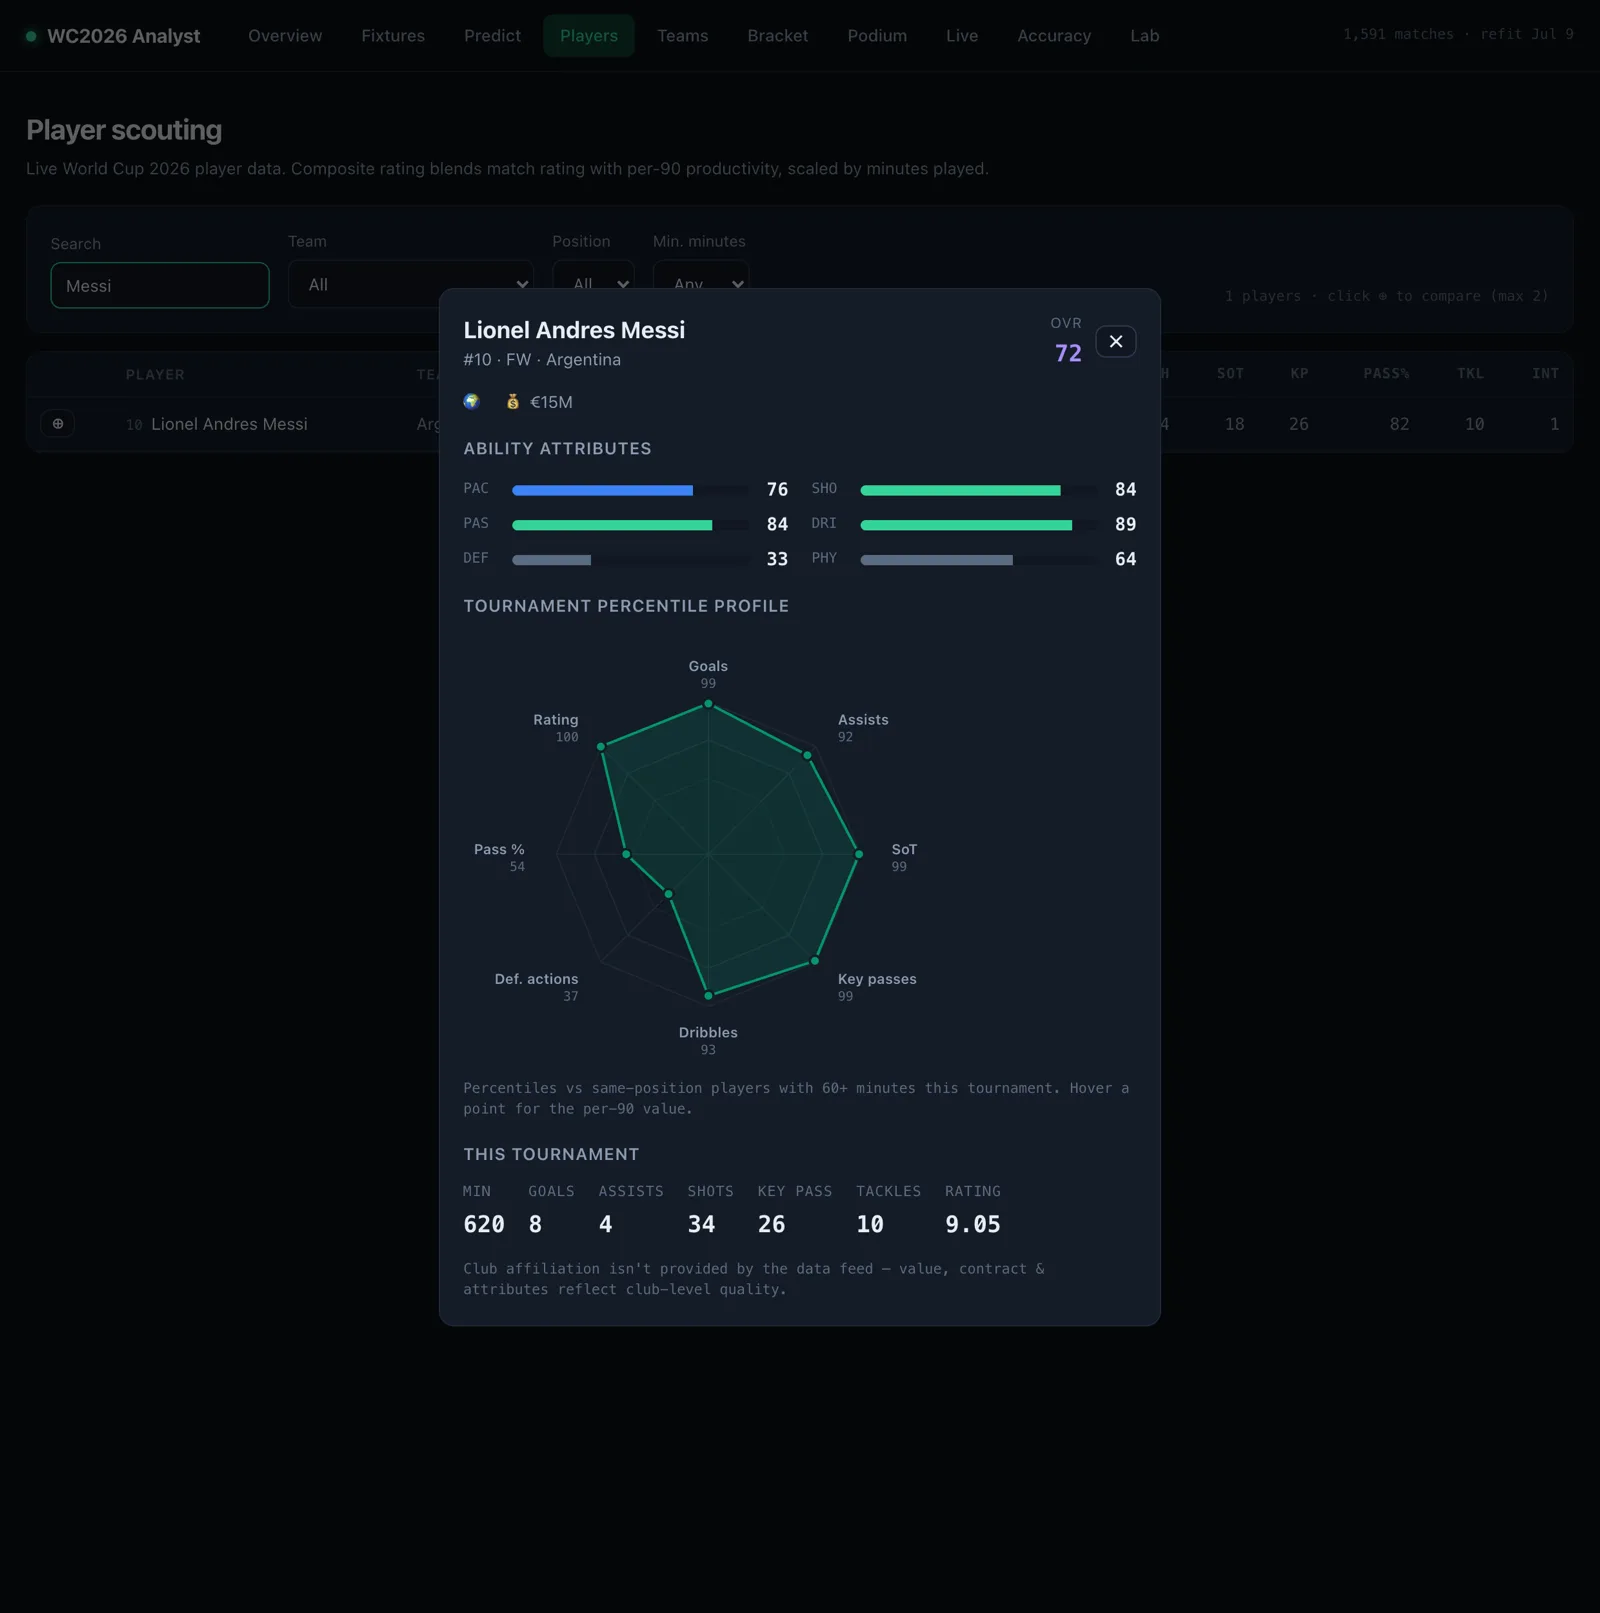
- Player percentile radars — 1,298 players profiled per-90 against others in their position, FBref-style. Messi at 39: 99th percentile for goals, 37th for defensive actions. The data knows him.
- A tournament simulator — the live knockout bracket played 200,000 times per refresh, penalties included, producing every team's title odds.
- A self-updating pipeline — GitHub Actions refits the model twice daily; every pick is frozen in a database before kickoff and graded after. I cannot quietly delete my bad picks, which I'd like the record to show was a deliberate choice and not something I now regret every time Switzerland does something unexpected.
How the model actually thinks a match through
Most explanations wave their hands right here, so let me walk one real prediction end to end — the final, Spain vs Argentina — and you'll see there's no magic in it, just five honest steps.
- Two numbers per team. Every team carries an attack rating and a defence rating, learned from history. Going into the final, Spain's defence rated 1.95 — the strongest number the model produced for any team all tournament (they'd conceded once in seven games). Argentina: attack 1.54, defence 1.47. That's it. Four numbers describe the match.
- Turn the four numbers into expected goals. A team's expected goals is basically its attack minus the opponent's defence. Spain's attack against Argentina's defence came out to 1.19 expected goals; Argentina's attack against Spain's elite defence, just 0.67. (The maths runs it through an exponential to keep everything positive, but the intuition is exactly that plain: my attack versus your defence.)
- Expand into every possible scoreline. Those two expected-goal numbers feed a Poisson distribution — the standard model for "how many rare, roughly independent events happen in a fixed window," which is almost the literal definition of goals in a football match. Out comes a probability for every score at once: 1–0, 2–1, 0–0, 3–2, the whole grid. For the final, the single most likely score was 1–0 Spain.
- Collapse to a winner, then let the market vote. Add up the grid and you get Spain 46% / draw 35% / Argentina 18%. On a close match this is where I hand the steering wheel to the bookmakers: de-vig 41 of them into a consensus and nudge the win/draw/loss numbers to match, keeping the model's own opinion only on the shape of the scoreline. (For the final the odds feed had run dry, so this one stayed model-only — Spain 64% to actually lift the trophy once you fold in extra time and penalties.)
- Pick for points, not for likelihood. The optimiser then chose the scoreline with the highest expected points rather than the highest probability — 1–0 Spain.
Spain won. The model made them 64% to; they lifted it. That's one match. Now imagine that exact pipeline running across all 104, refitting itself twice a day, and you have the whole site.
The model is older than some of my friends
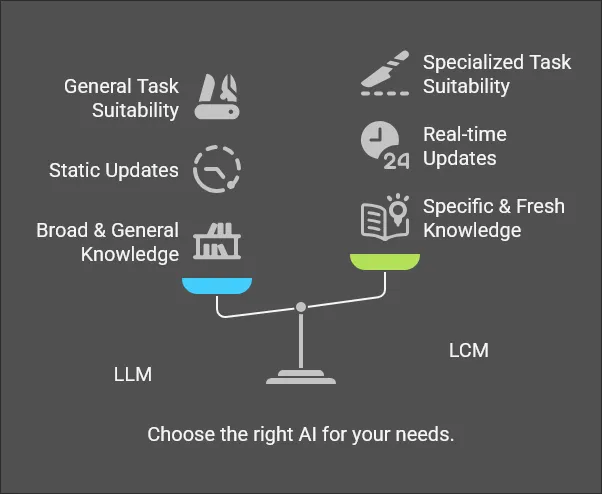
Worth saying plainly: the engine at the centre of all that is Dixon-Coles (1997). Not a neural network. Not an LLM. A statistics paper from the year Arsène Wenger won his first league title, with one small correction bolted on for low-scoring games (real football produces slightly more 0–0s and 1–1s than raw Poisson expects).
Why something that old? Because I had ~1,600 usable international matches, and on that little data a fancy model memorises noise while a simple one learns football. Every parameter in Dixon-Coles means something I can argue with — "the model thinks Argentina's defence is elite" is a checkable claim, not a black-box shrug. When you're learning, being able to interrogate your model beats squeezing out half a percent with something you can't explain.
Every layer, and what it actually earned
Dixon-Coles gives you the shape. But "the model" is really a stack of decisions bolted on top of that shape, and the honest version of this article isn't a list of features — it's a ledger of what each decision cost or earned, including the one I ripped out.
The training data (the boring part that matters most). 1,591 matches across every confederation, weighted so recent games count more, live World Cup results counted triple, fit by maximum likelihood in Python. The single most impactful decision here wasn't clever maths — it was coverage. Before I pulled in AFCON, the Asian Cup, the Gold Cup, and Copa qualifiers, African and Asian teams had maybe five matches of usable history each and near-random ratings. Adding those tournaments mattered more than any number of extra European friendlies would have. The model's intelligence isn't in the equation; it's in what you bother to feed it.
The FIFA-ranking prior (the one clean, measured win). Teams with thin histories get anchored toward their FIFA ranking instead of drifting on noise. This is the component with a properly isolated number: tuning it lifted held-out result accuracy from 64.0% to 66.4% across 396 matches. Not a vibe — a measured, reproducible gain.
Market calibration (the humbling one). My model once made Panama 64% favourites over Ghana. The market said Ghana. Ghana won 1–0 — a market-calibrated pick would have nailed the exact score while my model-only pick earned nothing. The market prices in everything a side-project can't see: injuries, team news, dressing-room mood. So now the model gets to pick the scoreline, but the market gets to pick the winner.
Knockout rules (the one that quietly broke everything). In knockouts, 1–1 isn't a final score — it's an invitation to extra time and penalties. That silently wrecks naive maths: "exactly 2 total goals" becomes nearly impossible, because a 1–1 can't stand. I got burned on this by a real wild-pick question before rebuilding the derived markets to convolve every drawn scoreline through an extra-time model and an empirical shootout distribution. Model the competition, not just the game.
The mistake I kept in on purpose: I trusted big names. I built FIFA-style ratings for all 1,298 players and blended "squad quality" into the predictions. Obviously better players mean a better team, right? The backtest said no: 96 points fell to 86. Match results already contain team strength; famous names just piled bias on top. As an Arsenal fan who watched expensively assembled squads finish above us for years while we "won the transfer window" — I should have known. The feature now lives on the Players page for humans to enjoy, with exactly zero weight in the model.
And the mistake that scared me most: I froze my own model and didn't notice for two weeks. My data client cached API responses to disk permanently — correct for historical data, silently catastrophic for a live tournament. Sixty-six matches came and went while the model kept making confident predictions from matchday-one knowledge. Nothing crashed. That's the whole lesson: a stale model doesn't fail loudly, it fails plausibly. The fix took five minutes; internalising it took longer. The model's last-refit date now sits permanently in the site's nav bar, because freshness you can't see is freshness you can't trust.
Underneath all of it sits the discipline that made the rest trustworthy: every tuning decision was tested on held-out data or a no-lookahead walk-forward replay, several "obviously good" features died right there before reaching production, and every live pick is frozen before kickoff so the report card below can't be fudged after the fact.
Here's the attribution table I'd want to see if someone else had written this — what each layer earned, including the one that made things worse:
| Layer | What it earned | Verdict |
|---|---|---|
| Dixon-Coles base | The whole scoreline framework | Foundational |
| Confederation coverage | Fixed near-random ratings for half the world | Huge |
| FIFA prior (tuned) | 64.0% → 66.4% | Measured win |
| Market calibration | The Ghana lesson; sharpest on close games | Biggest qualitative win |
| Expected-points optimiser | Same probabilities → more points, every match | Structural edge |
| Squad "star quality" | 96 → 86 pts | Removed. Negative. |
| Freshness loop | Prevented a 2-week silent regression | Saved the season |
Anyone can list what they built. Almost nobody shows what they measured and then deleted because the data said so — and that's the actual difference between "I made a football predictor" and "I know how to do applied ML."
The receipts
Because every pick is frozen pre-kickoff, I can show the model's real report card — there's a whole page on the site for it, the Model Lab:
- 66.4% correct results on 396 held-out historical matches; 75% for my picks in the live game (78 of 104).
- A calibration curve that hugs the diagonal — when the model says 60%, it happens about 60% of the time. This is the chart I'm proudest of, because you can't fake it retroactively.
- A Brier score of 0.166 (0.333 is guessing).
And the honest ceiling: about a third of football matches will defy any reasonable forecast. That's not a bug, it's the sport — it's why we watch. A model claiming 90% is lying. One that hits two-thirds and tells you which picks are coin-flips is the useful thing. (It also has no opinion whatsoever on who deserves the Golden Ball — award votes are politics, not physics, and the model knows the difference even when I wish it didn't.)
Questions people keep asking
What model predicts the scores?
A Dixon-Coles bivariate Poisson model. Each team gets an attack rating and a defence rating; those give each side an expected-goals number, and a Poisson distribution turns those into a probability for every possible scoreline — with a small correction for the fact that real football produces more 0–0s and 1–1s than raw Poisson expects.
Why not use machine learning or a neural network?
With only ~1,600 usable international matches, a complex model memorises noise while a simple, interpretable one learns football. Dixon-Coles has a handful of parameters, each of which means something you can check — like whether it rates a team's defence as elite — rather than a black box you have to take on faith.
How accurate was it?
66.4% correct results on 396 held-out historical matches, and 75% on my live picks (78 of 104). Its Brier score was 0.166, where 0.333 is equivalent to guessing and lower is better.
What is expected-points optimisation?
Instead of predicting the most likely score, the model picks the scoreline that maximises expected points under the game's scoring rules (here, 3 for an exact score and 1 for the correct result). Because of how partial credit accumulates, that pick is often not the most likely score.
Did adding player or squad quality help?
No — it made predictions measurably worse (backtest points fell from 96 to 86), because match results already encode team strength. The feature was removed from the model and kept only as a scouting display for humans.
What's next (and a question)
I built this with Claude Code as a pair-engineer — it wrote most of the code and ran every backtest I asked for; I supplied the scepticism and the mistakes documented above. As a way to learn statistics, data pipelines, and validation, I can't recommend the setup enough: a leaderboard, a deadline the real world enforces, and a scoreboard that grades you every matchday. Even the matchdays you sleep through.
Which brings me to the real question. The World Cup is over — Spain lifted it, which the model had at 64% and which was my pick. I finished 7th of the whole company without setting an alarm once, and here's the part that made me laugh: I did it with the highest accuracy near the top of the table — 75%, while everyone above and around me sat between 64% and 71%. I read more games right than the people who beat me. I still didn't win, because the game rewards volume and the occasional brave gamble, not just being correct more often.
Which is the exact lesson this whole project opened with — optimise for the thing you're actually scored on — served straight back to me, cold. My model was tuned for accuracy. The leaderboard was scored on points. I optimised the wrong objective on myself. And the final-weekend slide only underlined it: I overrode the model with my heart to back England in the semi (it said Argentina; Argentina won), and in the third-place game the model and I were simply both wrong. It was never an oracle — that's precisely the point, and the calibration curve still hugs the diagonal.
The Premier League is back next month — matches at genuinely watchable Singapore hours, a 38-game season of data instead of a 7-game knockout, and a model owner with a documented Arsenal bias that the backtests will need to hold in check.
Should I build one for the EPL season? And what should it predict — scorelines, the title race, top four, relegation odds?
I have a feeling I already know what the model will say about Arsenal's title chances. I'm just not sure I'm emotionally ready for a calibrated answer.
Built for an office prediction game played for bragging rights (and, at #1 in Singapore, a hypothetical mug). Not betting advice. The model has never heard of "cagey north London derby energy" and I refuse to teach it.