A companion to the prediction engine I built for a World Cup I never watched. That one tried to guess results. This one goes backwards, into matches that already happened, and asks a different question.
Key takeaways
- I loaded every completed pass from the 2018 and 2022 men's World Cups into a Neo4j graph — one node per player per match, one weighted edge per passing connection — and computed who holds each team's network together.
- Across 22 matches, the structural hub was never among his team's leading goal contributors — 0 for 19, counting only matches where a player actually scored or assisted, and counting every player tied at the top. Not one hub was a forward or a winger.
- This is partly definitional and I'll say so up front. Centrality rewards bridging; strikers receive final passes. The interesting part isn't the headline — it's what happened when I tried to break it.
- I built a second, stricter measure and it disagreed with the first about who the hub was 13 times out of 22. "The hub" is not one settled fact. It depends which question you ask.
- The player both metrics kept underrating: Nicolás Otamendi, a 34-year-old center-back, who comes out as the most load-bearing player in all 7 of Argentina's title-run matches.
Start with the objection
Here's the finding, stated as baldly as it deserves: across 22 World Cup matches from two tournaments and four teams, the player at the structural center of the passing network was never one of his team's leading goal contributors. Nineteen matches had a goal or assist to compare against. Nineteen times, different player. Zero forwards or wingers among the hubs.
And if you know anything about graph theory, you should already be suspicious — so let me make your objection for you before you make it.
Betweenness centrality measures bridging: it rewards the player whose removal would fracture the flow of the ball into disconnected pieces. Center-backs and defensive midfielders bridge defence to attack on essentially every possession. Forwards receive the last pass and then shoot. These are different jobs, and a metric built to find bridges will obviously not find finishers. Calling that a discovery is close to announcing that goalkeepers rarely take corners.
So I'm not going to pretend the headline number is the story. The story is what happened when I stopped admiring the result and started trying to knock it over.
What the picture actually shows
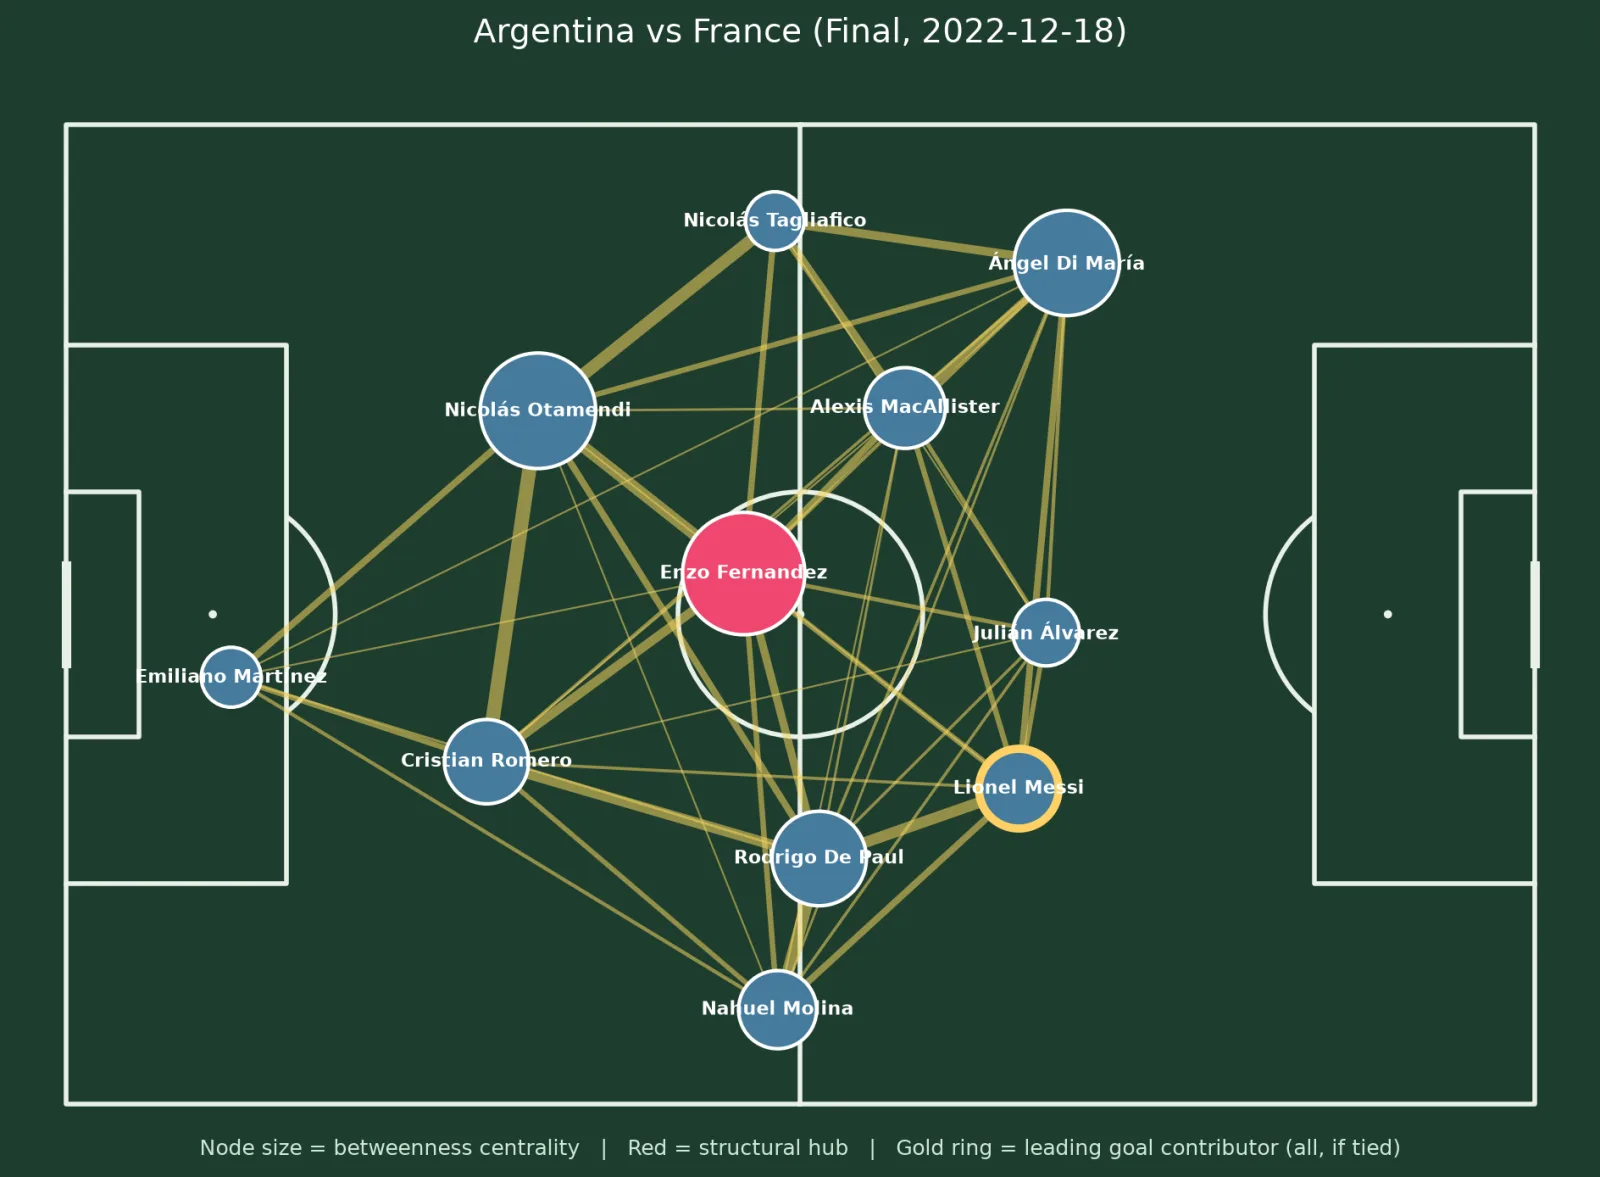
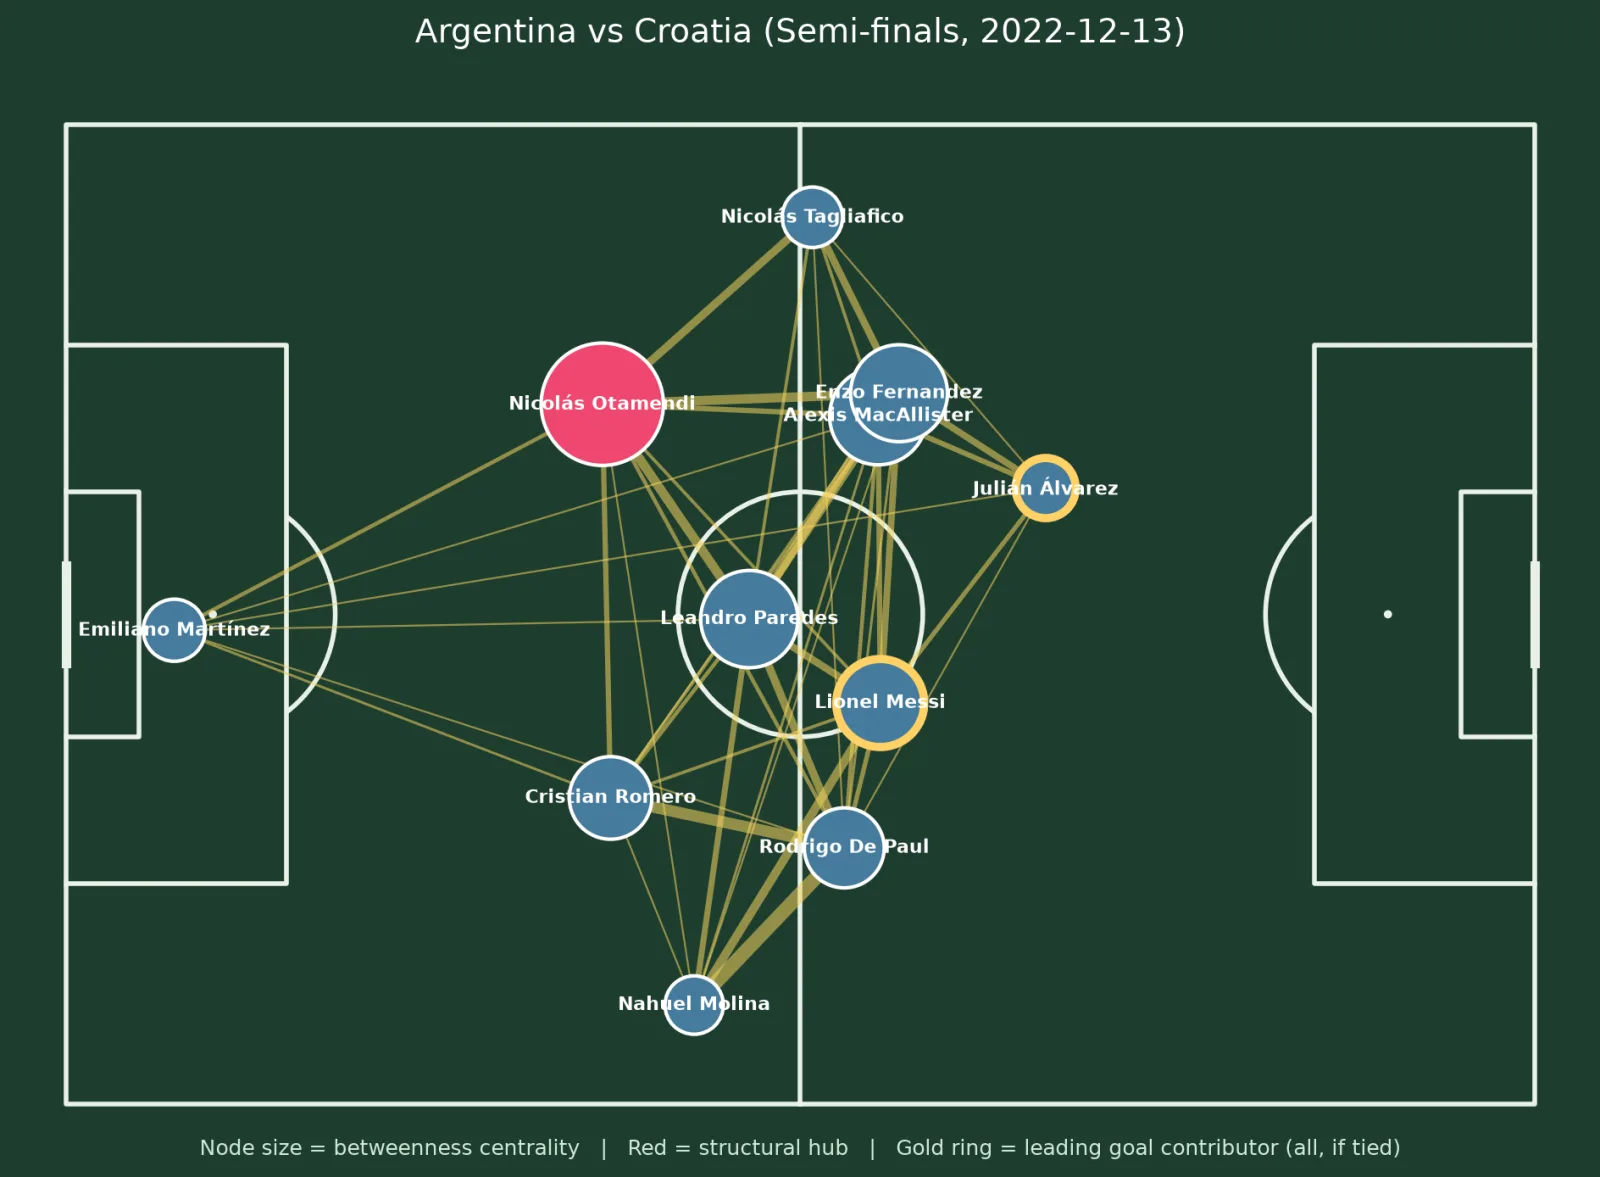
Every node is a player, placed at their average position on the pitch. Node size is betweenness centrality, red marks the structural hub, and gold rings mark the leading goal contributor — all of them, when they're tied, which turns out to be about half the time. Edge thickness is how often that passing lane was actually used.
The 2022 final is the cleanest illustration in the set. Messi scored twice — the opener from the spot and the go-ahead goal in extra time — and ranked 7th in centrality. The hub was Enzo Fernández, a 21-year-old defensive midfielder in his first World Cup.
One important constraint on all of these: the networks are built from play before each team's first substitution. That's deliberate. A network that includes the 78th-minute reshuffle tells you about the manager's panic, not the team's intended shape.
Two Spains, four years apart, same skeleton
Spain went out on penalties in the Round of 16 in both tournaments. The 2018 side and the 2022 side share almost no personnel. In all eight matches, the load-bearing player was a defender or a defensive midfielder.
| Date | Match | Structural hub | Leading goal contributor |
|---|---|---|---|
| 2018-06-15 | Portugal 3–3 Spain | Sergio Ramos | Diego Costa (rank #11) |
| 2018-06-20 | Iran 0–1 Spain | Sergio Busquets | Diego Costa (rank #9) |
| 2018-06-25 | Spain 2–2 Morocco | Sergio Ramos | Carvajal † (rank #5) |
| 2018-07-01 | Spain 1–1 Russia | Isco | — own goal, no contributor |
| 2022-11-23 | Spain 7–0 Costa Rica | Jordi Alba | Ferrán Torres † (rank #9) |
| 2022-11-27 | Spain 1–1 Germany | Aymeric Laporte | Jordi Alba † (rank #7) |
| 2022-12-01 | Japan 2–1 Spain | Rodri | César Azpilicueta † (rank #4) |
| 2022-12-06 | Morocco 0–0 Spain | Rodri | — no goal or assist |
† Several players tied at the top in these matches; one is named for readability. The hub isn't any of the tied players either — that's the version of the test I actually ran.
That Russia row is worth pausing on.
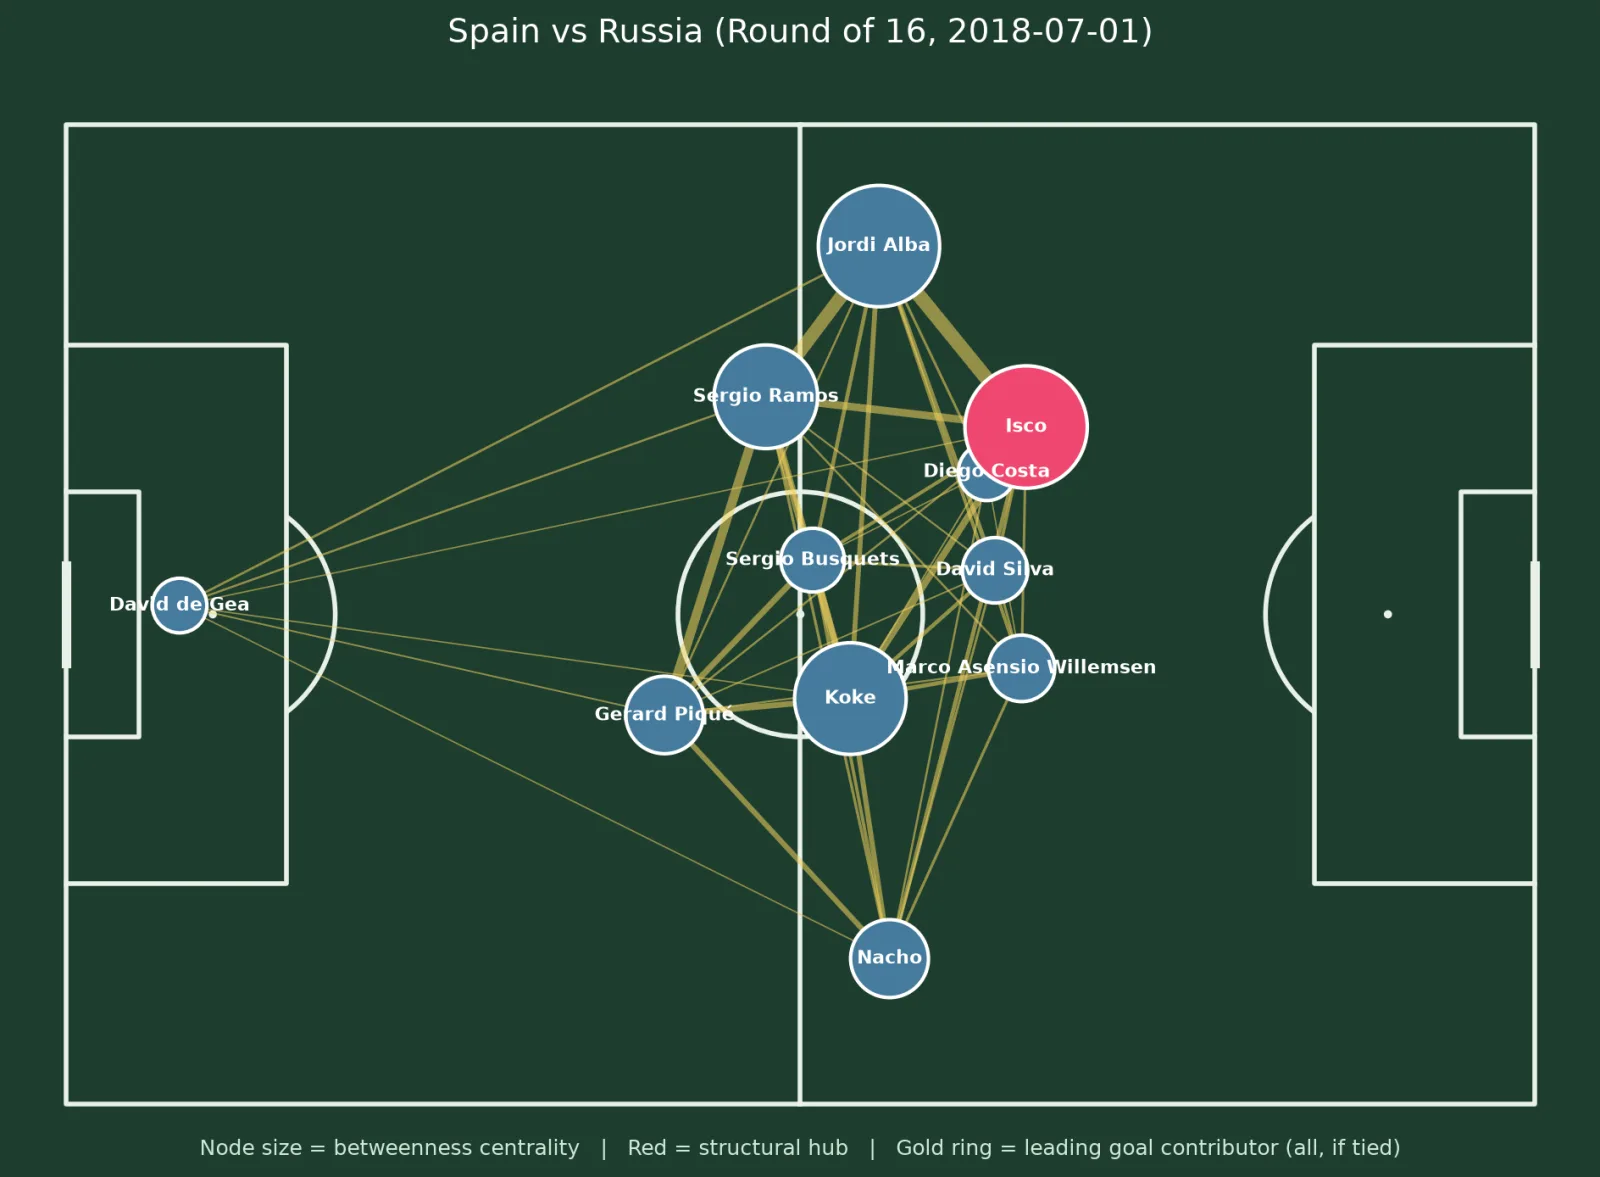
Spain's only goal was an own goal by Sergei Ignashevich, so no Spain player recorded a goal or an assist at all. It's the only network in the set with a hub and no gold ring anywhere. The match drops out of the comparison entirely, alongside the two goalless draws.
I mention it because the write-up this post grew out of had Sergio Ramos down as the scorer, and he wasn't — he scored in the penalty shootout, which my pipeline was quietly counting as a match goal. More on that below.
The 7–0 against Costa Rica is my favourite row in that table, and not for the reason you'd guess.
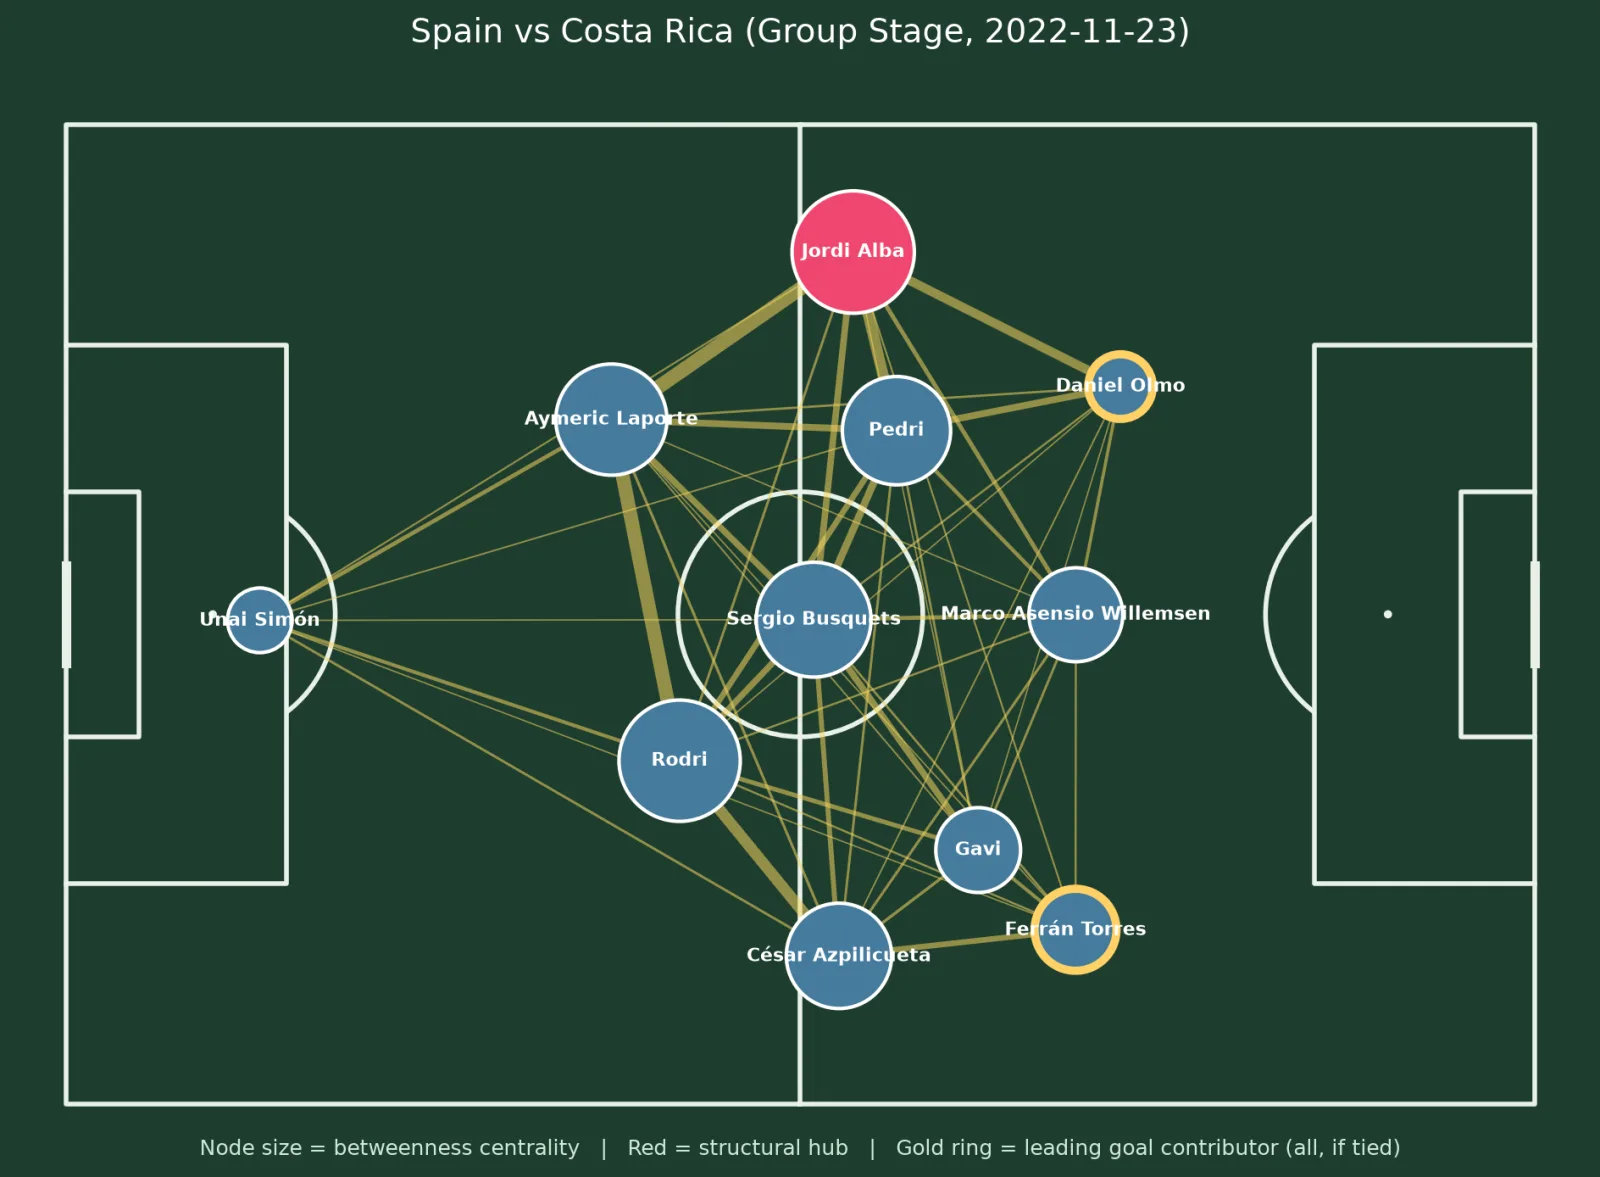
Seven goals, six different scorers, and the hub is the overlapping left-back. But look closely at the node sizes: Alba's red circle is barely larger than Busquets' blue one. His centrality score was 0.017 — the lowest hub score of any of the 22 matches. In a 7–0, the network flattens out. Everybody was involved, nobody was a bottleneck, and "the hub" that day is a title won by a rounding error. That's a real property of the match, and it's the kind of thing a table of names hides completely.
Champions aren't built around their scorers either
France in 2018 and Argentina in 2022 won with the two most celebrated attackers alive in their lineups. Across 14 matches, neither Kylian Mbappé nor Lionel Messi was ever the most central player in his own team's network.
Argentina's hub rotated constantly — Molina, Rodríguez, Otamendi twice, Acuña, Mac Allister, and Enzo Fernández in the final — and it was never Messi. In the five matches where he led or co-led Argentina's goal involvement, his centrality ranks were 9th, 6th, 5th, 5th and 7th.
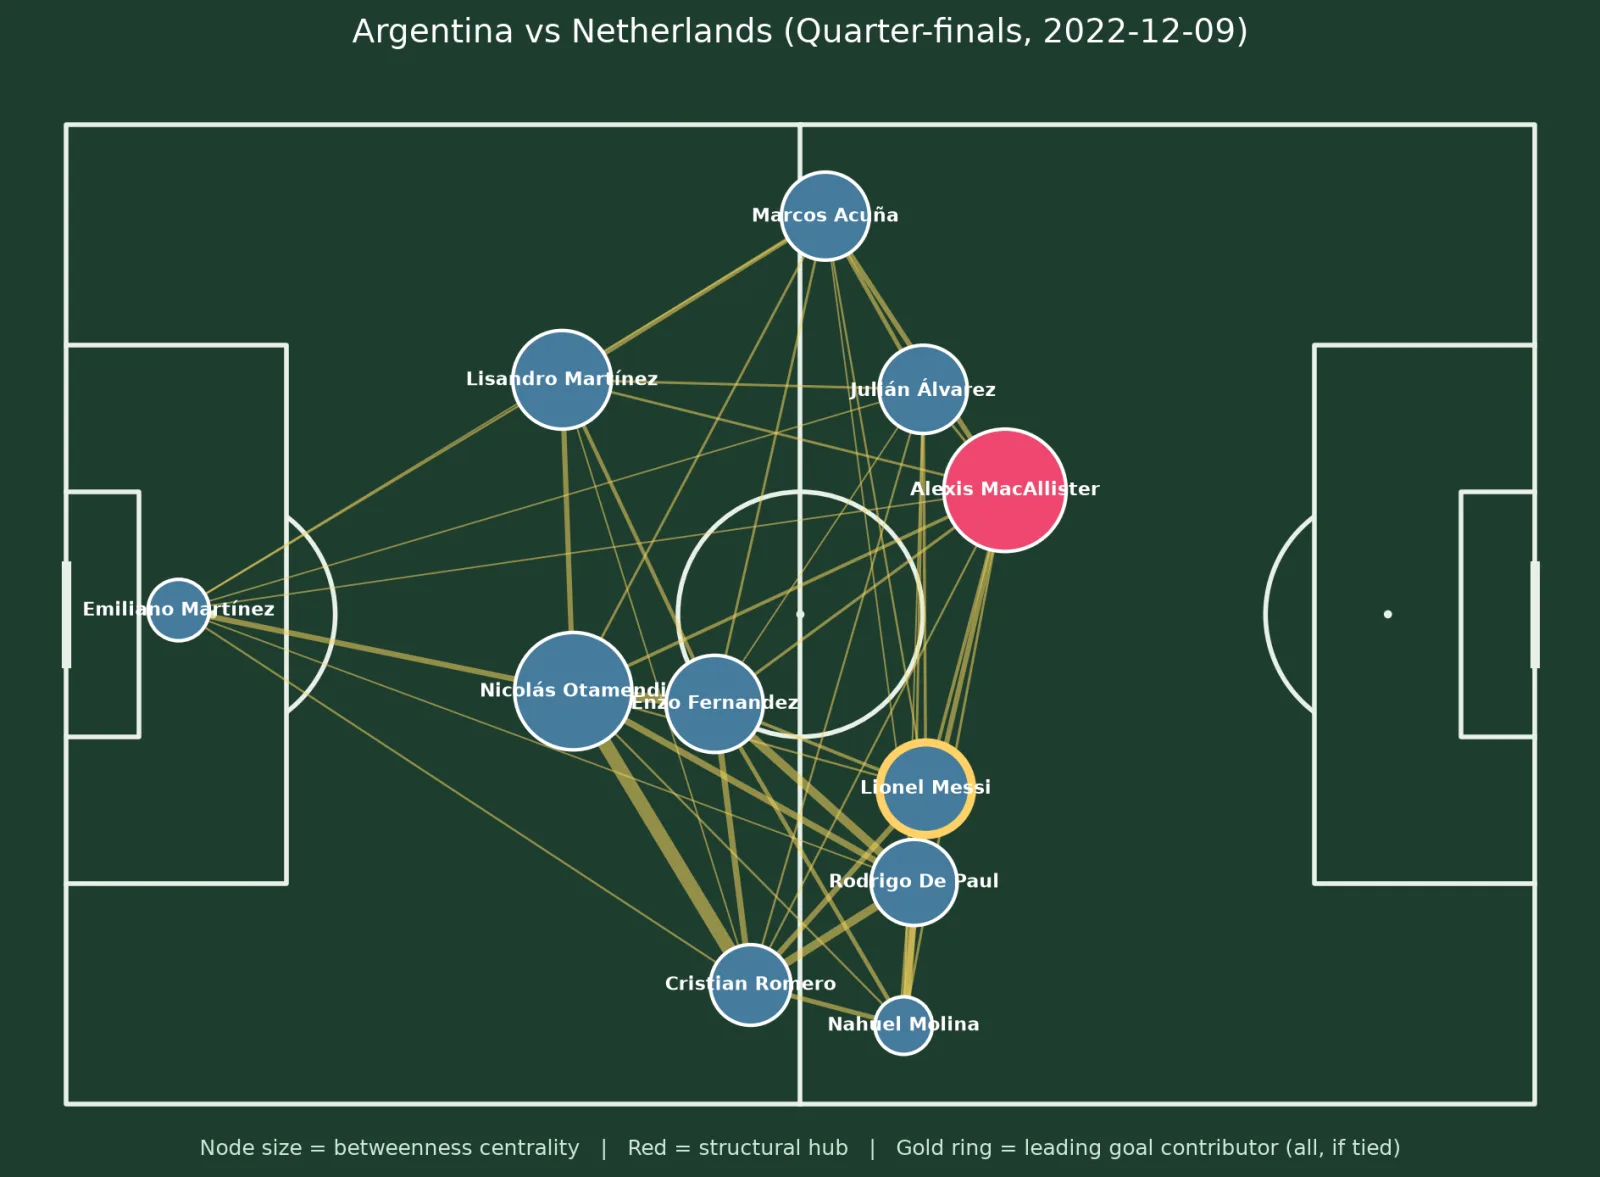
That quarter-final was Messi's most involved match of the tournament — a goal and an assist — and he still finished 5th in centrality.
The closest any champion's scorer came to being their team's hub was the 2018 final:
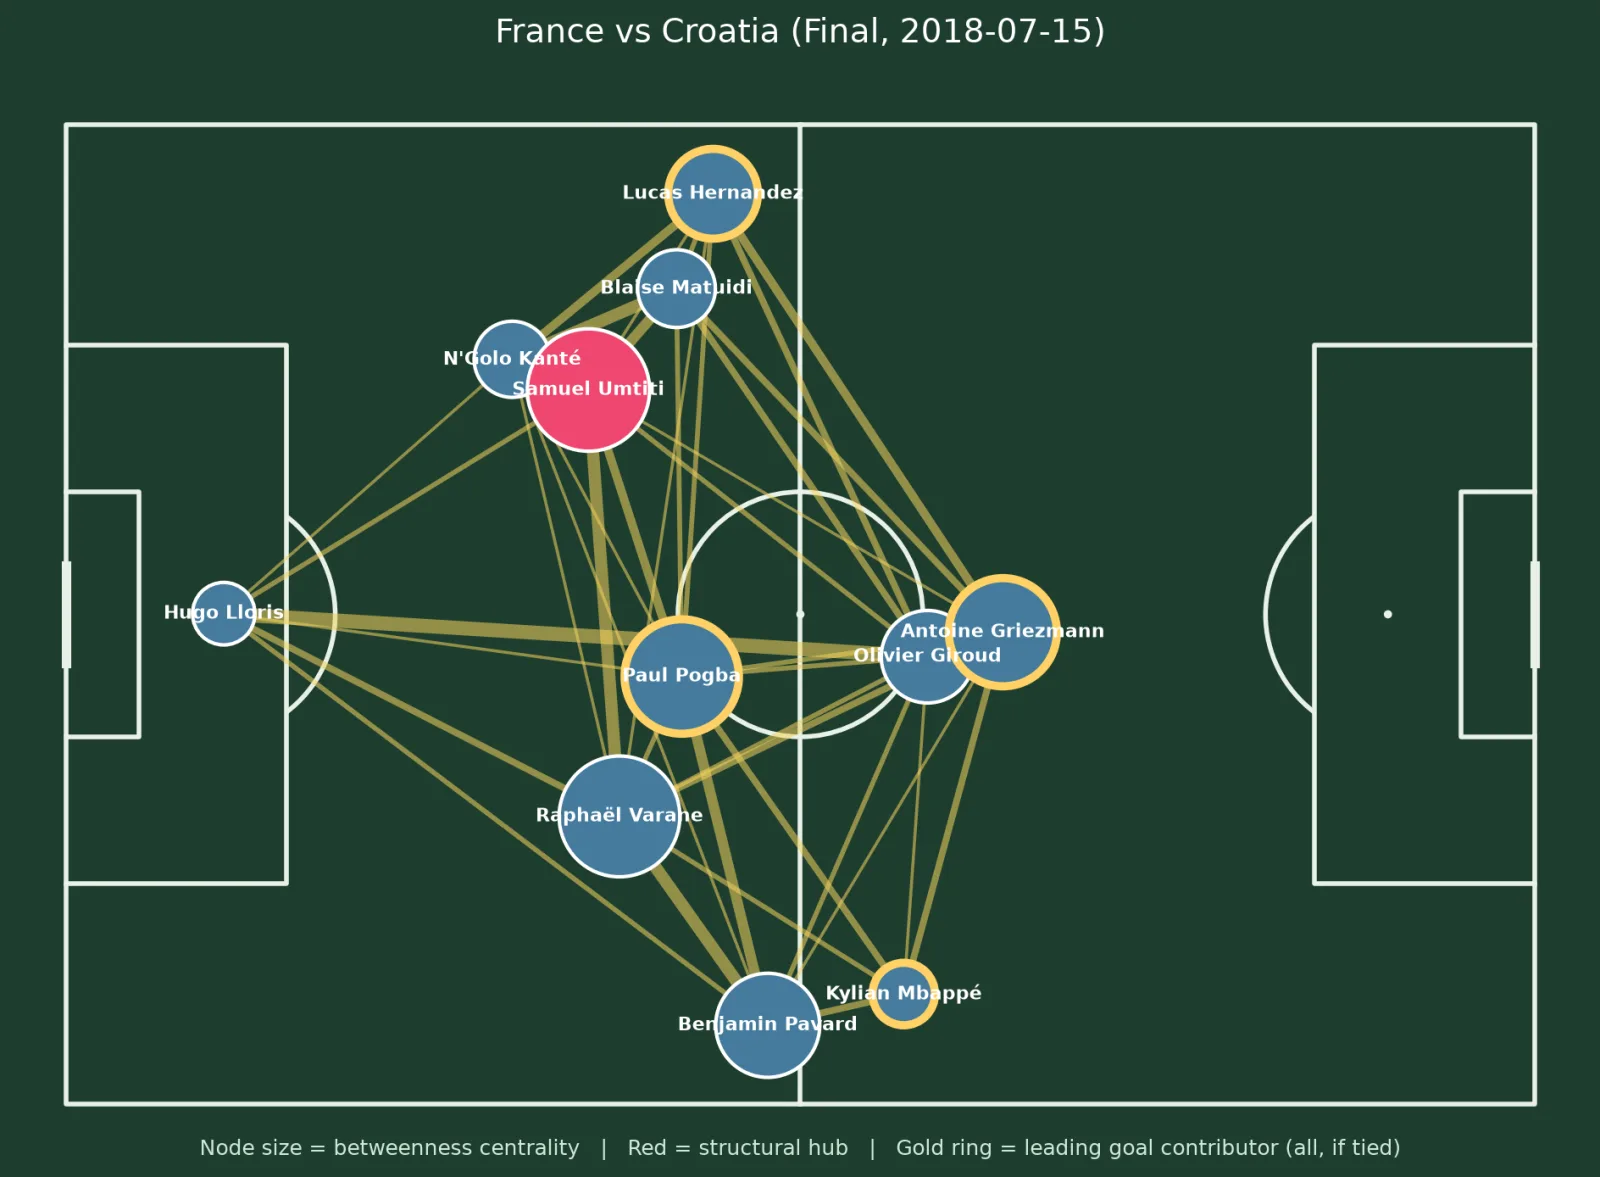
Samuel Umtiti was the hub. Four France players tied on goal involvement that day — hence four gold rings — and Paul Pogba, who scored, ranked 3rd in centrality. You can see it in the picture, his node nearly matching Umtiti's. Across 22 matches that is as close as any leading contributor got to being his team's structural hub.
The part where I try to break my own finding
Here's the problem I ran into, and it's the reason this project got interesting.
These single-match networks are near-complete graphs. Over 45 minutes of football, essentially every starter passes to essentially every other starter at least once, so graph density sits around 0.85–0.95. That means a purely topological measure — one that only asks whether two players are connected, never how often — has almost nothing to bite on. The real structure lives in the edge weights.
So I built a second measure that uses them. Instead of asking "is there a connection," it asks: if you surgically remove this player, how much does the team's volume-weighted passing efficiency collapse? Heavily-used lanes count as short, rarely-used ones as long, and you measure the drop when a node is cut out, compared against cutting a random teammate.
Run both on the same 22 matches and they agree about who the hub is 9 times out of 22. Forty-one percent.
| Match | Betweenness hub | Volume-weighted hub | |
|---|---|---|---|
| Spain vs Iran | Sergio Busquets | Isco | differ |
| Spain vs Morocco '18 | Sergio Ramos | Thiago Alcântara | differ |
| Spain vs Russia | Isco | Sergio Ramos | differ |
| Spain vs Costa Rica | Jordi Alba | Rodri | differ |
| France vs Denmark | N'Golo Kanté | Raphaël Varane | differ |
| France vs Argentina | N'Golo Kanté | Samuel Umtiti | differ |
| France vs Belgium | Raphaël Varane | Benjamin Pavard | differ |
| Argentina vs Netherlands | Alexis Mac Allister | Nicolás Otamendi | differ |
| Argentina vs France | Enzo Fernández | Nicolás Otamendi | differ |
(Nine of the thirteen disagreements. The full 22-row table is in the project repo.)
I find this more interesting than the original result. Two defensible definitions of "who holds this team together," applied to identical data, and they disagree the majority of the time. Anyone who tells you a passing network has a hub is quietly picking one metric and not mentioning it.
The player both metrics underrated
Under the volume-weighted test, one name stops rotating.
Nicolás Otamendi is the most disruptive player to remove in all 7 of Argentina's 7 matches, including the final. Plain betweenness credited him as hub only twice, spreading the honour across six different players.
By the stricter measure, a 34-year-old center-back was the only structural constant in Argentina's title run. There is no version of the highlights reel where this is visible.
What survives, and what doesn't
The original finding mostly holds, with one honest exception.
Under the volume-weighted definition, the hub is among his team's leading goal contributors in 1 of 19 comparable matches: Otamendi against Australia. And even that one is softer than it looks — Otamendi's contribution was an assist, not a goal, and he was tied at the top with two other players. So 18 of 19 under the stricter metric, 19 of 19 under betweenness.
The position breakdown of the betweenness hub across all 22 matches doesn't move at all:
| Position | Matches as hub |
|---|---|
| Center-back | 10 |
| Defensive midfield | 5 |
| Full-back | 4 |
| Central / attacking midfield | 3 |
| Forward / winger | 0 |
And the limits, stated plainly, because I'd rather you heard them from me:
- n = 22, of which 19 are comparable. Two tournaments, four teams, three of them elite European or South American sides. This is not a claim about football in general.
- "Leading scorer" is mushier than it sounds. In 9 of the 19 comparable matches, two or more players tied at the top. I ran the test against the full tied set rather than picking one name, which is the strictest version — but a single-name table hides that, and mine did at first.
- I recounted the goals, then fixed the pipeline that got them wrong. It had been counting penalty-shootout goals as match goals — 85 phantom goals across 13 matches. That inflated Messi's involvement in both the final and the quarter-final, and it credited Spain's own-goal draw with Russia to Sergio Ramos, who had only scored in the shootout. One missing period filter. Every number above now comes from a rebuilt graph, and it agrees exactly with the independent recount I did straight from the raw event JSON. The structural finding didn't move an inch — centrality never depended on the goal column — but several of the sentences I first wrote did.
- Starters only, pre-substitution. Good for measuring intended shape, useless for anything after the 60th minute.
- The result is partly definitional, as I said at the top. Its value isn't "wow, strikers aren't central." It's that the goal column and the network are measuring genuinely different contributions, and only one of them ends up in the newspaper.
One more thing in the same data
While the pass graph was loaded I also pulled raw style metrics — pass length, forward progress, tempo — across all 128 team-matches of each tournament. Two things fell out immediately. Football itself got measurably more patient between 2018 and 2022: +9.9% completed passes per 90, and −22.3% forward progress per pass. More passing, going less far forward each time.
And within that, Spain, France and Argentina were playing recognisably different sports. Spain completed 729 passes per 90 at a 90% success rate, moving the ball forward 1.34 yards per pass. France managed 354 at 79%, but 4.35 yards forward each time — more than three times Spain's directness on under half the volume.
That deserves its own write-up rather than a footnote to this one, so it's the next post.
How this was built
- Data: StatsBomb's free open-data release — full event-level detail for both tournaments, including every pass's passer, recipient, and pitch coordinates.
- Graph model: Neo4j. One
Appearancenode per player per match, one weightedPASSED_TOedge per repeated connection, scoped to play before each team's first substitution. - Centrality: degree, betweenness and PageRank via Neo4j Graph Data Science, with an automatic NetworkX fallback so the pipeline runs without a GDS licence.
- The fragility test: invert pass count into edge distance, remove a node, measure the drop in shortest-path efficiency while holding the compared node-pairs fixed. (I had this backwards on the first attempt — treating heavily-used lanes as long rather than short, which inverts the entire result. Worth checking twice if you build one.)
- Goals and assists: period 5 (the shootout) excluded at the transform step, so a converted penalty in a shootout is not a match goal; own goals arrive as their own event type and are correctly attributed to nobody. Cross-checked against an independent count straight from the raw JSON — the two agree on all 22 matches.
- Visualisation: mplsoccer.
The honest summary: a graph made me look at a football match differently, then a second graph made me distrust the first one, and then the goal column turned out to need checking too. All three of those were worth the weekend.